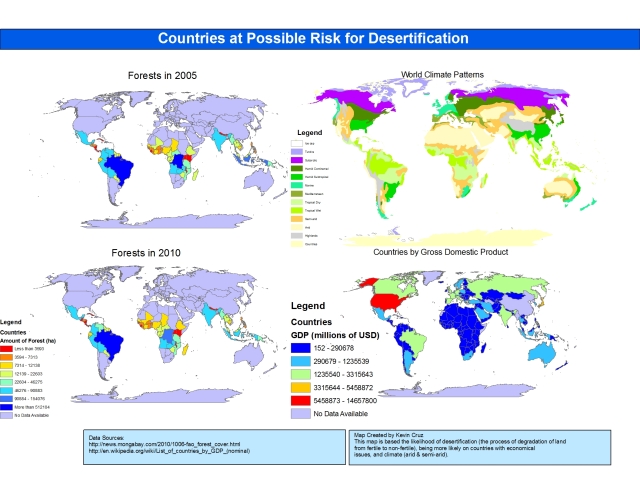
The following maps are examples portraying the problem of desertification around the world by taking the factors that help contribute to desertification (population growth rate, economy, rainforest coverage, climate patterns around the world, etc.)
“This map represents parts of the world which are likely to have desertification. 3 factors were taken into account: economy, rainforest coverage, and climate. Desertification happens mostly in arid & semi-arid climates, however the economy may also play a role in this, as it will encourage countries that have large rainforests but poor economy to cut down the trees and start the process of desertification” ~ KC
The countries with a yellow to red color or are either decreasing in population size or increasing at very small rates. Many of these countries are very well developed and are far away from zones of desertification. Countries with green to blue color are countries that are growing at very high rates. Many of these countries are located in developing areas and are very near zones of desertification. Many of these countries also have low GDPs meaning that the people will have to rely on the land to produce subsidence. This will lead to an increase in the spread of desertification. – Bryan Greene
Kevin Ly:
“This shows the annual rainfall of the United States. It is easy to see that the amount of rainfall can influence desertification. This also show the areas at risk and place that may be in danger of desertification.” – Kevin Ly

The maps shown in this page were created using GIS software. Special thanks to Ms. Burgess for showing us how to map. More information can be found at her website.


